Description
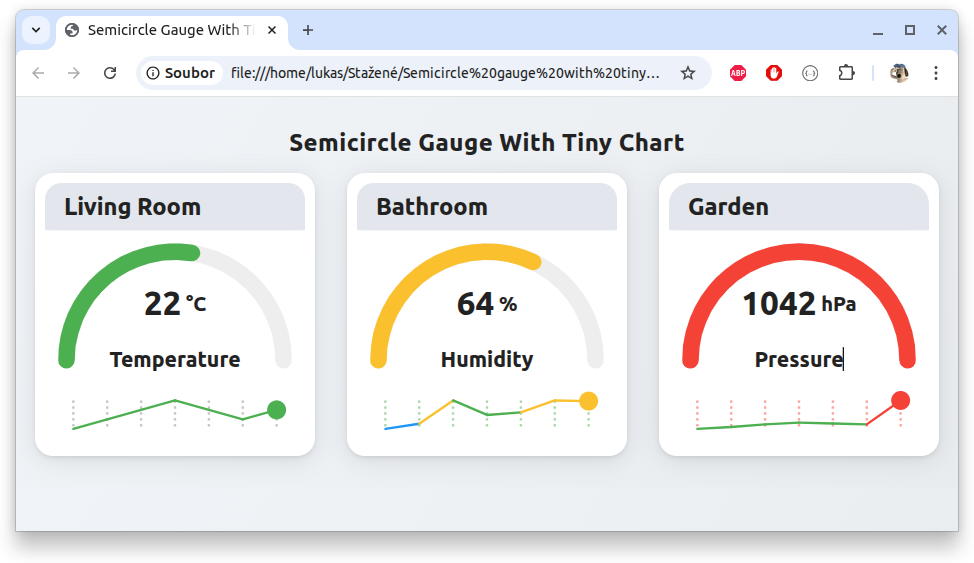
This component displays a modern semicircular gauge with a value arc, customizable header, and a tiny line chart beneath the gauge. The chart can show recent data points, and each point can be marked with a vertical dotted line. The gauge is highly customizable, supporting color stops, units, tick styling, and more. It’s ideal for dashboards and compact data displays.
Download of source with example code
Function Variables Help
Function:createSemicircleGaugeWithChartSVG(options)
Key Variables (Options):
| Variable | Type | Default | Description |
|---|---|---|---|
width | Number | 220 | Width of the SVG gauge (in pixels). |
height | Number | 220 | Height of the SVG gauge (in pixels). |
semicircleHeight | Number | 90 | Height of the semicircle arc. |
chartHeight | Number | 36 | Height of the chart area below the gauge. |
semicircleYOffset | Number | 70 | Vertical offset for the semicircle (moves gauge down). |
chartYOffset | Number | 90 | Vertical offset for the chart (moves chart down). |
startAngleDeg | Number | 180 | Start angle of the semicircle (degrees). |
endAngleDeg | Number | 360 | End angle of the semicircle (degrees). |
value | Number | 0 | Current value to display on the gauge. |
minValue | Number | 0 | Minimum value of the gauge. |
maxValue | Number | 100 | Maximum value of the gauge. |
frontColor | String | “#ff5722” | Default color for the value arc and chart line. |
backColor | String | “#eee” | Color for the background arc. |
frontColorStops | Array | null | Array of {value, color} for dynamic arc/chart coloring. |
getFrontColor | Function | null | Function to determine color based on value. |
header | String | “Measurement” | Footer label below the gauge. |
headerLabel | String | “Position” | Header label at the top of the gauge. |
headerLabelFontSize | Number | 20 | Font size for the header label. |
headerLabelColor | String | “#222” | Color for the header label text. |
headerLabelBg | String | “#e3e7ed” | Background color for the header label area. |
headerTopRadius | Number | 14 | Border radius for the top of the header area. |
valueFontSize | Number | 28 | Font size for the main value. |
headerFontSize | Number | 18 | Font size for the footer label. |
strokeWidth | Number | 14 | Thickness of the semicircle arc. |
units | String | “” | Units to display next to the value (e.g., “°C”, “%”). |
chartData | Array | [] | Array of numbers for the chart line. |
chartLineColor | String | null | Color for the chart line (overrides dynamic color). |
chartLineWidth | Number | 2 | Thickness of the chart line. |
chartMin | Number | null | Minimum value for the chart Y axis. |
chartMax | Number | null | Maximum value for the chart Y axis. |
tickColor | String | “#888” | Color for the vertical y-ticks at each chart point. |
tickAlpha | Number | 0.5 | Opacity (0-1) for the y-ticks. |
tickWidth | Number | 2 | Thickness of the y-ticks. |
showChartTicks | Boolean | true | Show or hide the vertical y-ticks. |
Usage Example:
createSemicircleGaugeWithChartSVG({
  value: 22,
  minValue: 0,
  maxValue: 40,
  units: "°C",
  header: "Temperature",
  headerLabel: "Living Room",
  chartData: [20, 21, 22, 23, 22, 21, 22],
  frontColorStops: [
    { value: 10, color: "#2196f3" },
    { value: 25, color: "#4caf50" },
    { value: 40, color: "#f44336" }
  ],
  tickColor: "#2196f3",
  tickWidth: 3,
  showChartTicks: true,
  headerTopRadius: 16
});
Dynamical update gauge:
let value = 22;
let chartData = [20, 21, 22, 23, 22, 21, 22];

function updateGauge() {
  semicircleGaugeWithTinyChart("gauge1", {
    value: value,
    units: "°C",
    headerLabel: "Living Room",
    header: "Temperature",
    minValue: 0,
    maxValue: 40,
    frontColorStops: [
      { value: 10, color: "#2196f3" },
      { value: 25, color: "#4caf50" },
      { value: 40, color: "#f44336" }
    ],
    chartData: chartData,
    tickColor: "#2196f3",
    tickWidth: 3,
    headerTopRadius: 16
  });
}

// Initial render
updateGauge();

// Example: update every 2 seconds
setInterval(() => {
  // Simulate new value and chart data
  value = Math.round(15 + Math.random() * 20);
  chartData.push(value);
  if (chartData.length > 10) chartData.shift(); // keep last 10 points
  updateGauge();
}, 2000);