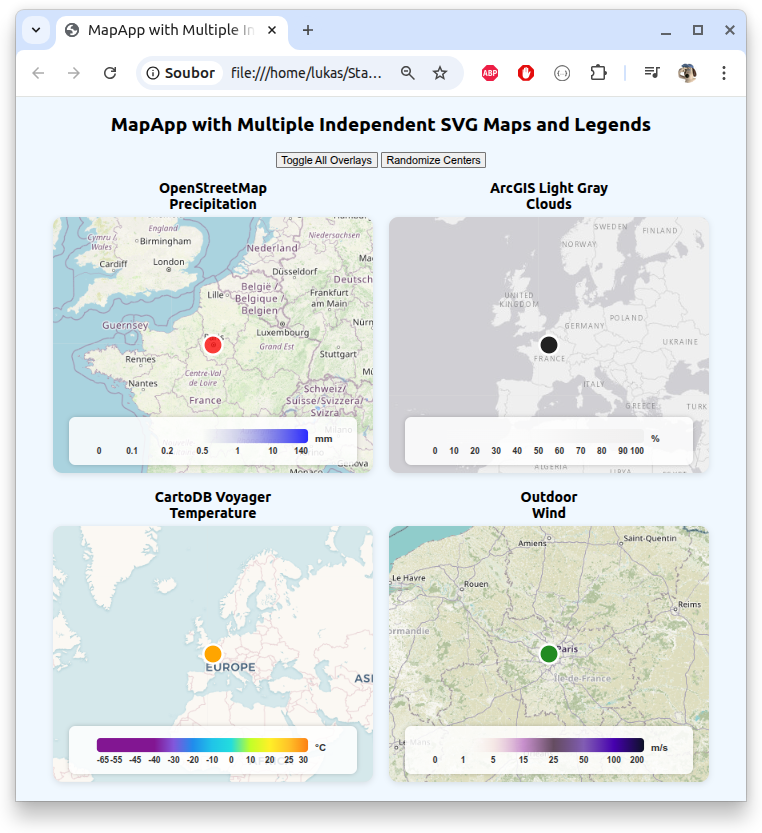
This web app demonstrates multiple interactive weather maps on a single page. Each map is fully SVG-based for crisp visuals and scalability, featuring:
- Raster map tiles and weather overlays as SVG
<image>elements. - Unique SVG filters and gradients per map instance to avoid conflicts.
- A vector home marker showing a fixed location.
- A dynamic, scalable SVG legend with color gradients and labels matching the overlay type.
- Independent pan, zoom (mouse wheel), and double-click to recenter on home.
For source contact admin.
Key Features:
- Multiple Instances: Each map runs independently with its own SVG container and legend.
- Dynamic Legends: Legends update automatically to reflect the overlay type and use unique SVG gradient IDs.
- User Interaction: Pan by dragging, zoom with mouse wheel, double-click to recenter.
- Overlay Control: Toggle overlays on/off globally and randomize map centers with buttons.
Usage Instructions:
- Pan: Click and drag on any map.
- Zoom: Hover and scroll mouse wheel.
- Recenter: Double-click to reset map center to home location.
- Toggle Overlays: Use the “Toggle All Overlays” button to enable/disable overlays on all maps.
- Randomize Centers: Use the “Randomize Centers” button to shift all maps to random nearby locations.
Implementation Notes:
- Replace
YOUR_OPENWEATHERMAP_API_KEYwith your actual API key for overlays. - Each map instance generates unique SVG IDs for filters and gradients to prevent conflicts.
- The home marker is a scalable SVG circle positioned based on latitude/longitude.
- The legend is fully SVG with a linear gradient and text labels for clarity and scalability.
Benefits:
- Clean separation of map instances for modularity.
- Fully scalable vector legends and markers for high-DPI displays.
- Easy to extend with new overlays or base maps by adding new instances.
Example
This example creates a map centered on Paris with precipitation overlay enabled. You can update overlay types, toggle overlays, or change the center and zoom programmatically, then call render() to update the display.
const container = document.getElementById("osm-map");

const map = new MapApp(container, {
  id: "osm",
  tileUrl: "https://tile.openstreetmap.org/{z}/{x}/{y}.png",
  overlayUrl: "https://tile.openweathermap.org/map",
  apiKey: "YOUR_OPENWEATHERMAP_API_KEY",
  homeLat: 48.8584,  // Paris latitude
  homeLon: 2.2945,   // Paris longitude
  zoom: 10,
  overlayType: "precipitation_new",
  overlayEnabled: true,
  overlayRefreshInterval: 120000, // 2 minutes
  homeMarkerSize: 24,
  homeMarkerColor: "rgba(255,0,0,0.75)",
});

// Later, you can change overlay type:
map.setOverlayType("clouds_new");

// Enable or disable overlay:
map.enableOverlay(false);

// Programmatically change center and zoom:
map.centerLat = 40.7128;  // New York latitude
map.centerLon = -74.0060; // New York longitude
map.zoom = 12;
map.render();